
Data Dump: 2023-24 Substitution trends in the Premier League
Managers are making more substitutions earlier in matches (good)! Except in one circumstance

I wasn’t going to write a post about substitution data this year because, as I’ll explain at the end of this post, it’s pretty clear that any impact substitutions had on matches this year was probably more the result of something else that was happening in the Premier League. That mostly leaves me with a bunch of tables detailing the average times managers tend to make their subs and how often they’re doing it. It probably would have worked better as a thread, but I kept hearing Carl Anka’s voice in my head as he preaches rather than writing a thread publish the work somewhere that you own so it will still exist once Twitter goes caput. So here we are.
Sometime around February or March I began to see a bunch of articles deep diving into the effect of substitutions. This began with Michael Caley crafting a two-part study on substitution effects. A few weeks later Mark Thompson published his “what do we actually know about football?” newsletter centered around how analysts widely agree that substitutions help you and managers should make more of them earlier in the match, but, as Thompson points out, “Pep Guardiola doesn’t use his substitutes.” That right there seems to go against everything we thought we knew about the sport - though Kwestthoughts readers shouldn’t be too surprised by this1.
Substitutions suddenly seemed to be hot in the streets. OG Kwestthoughts readers know that we’ve been ahead of the game as I’ve been tracking substitution data since the 2020-21 season and trying to gage the impact managers substitutions have. At the end of each season I try to write something about it for no other reason than to just publish what I have.
This was the second post COVID season that had the new substitution rules so we can see how managers adapted to that as well.
As always a quick note about the data set.
It’s not comprehensive of all 20 Premier League teams for the simple reason that I don’t have that kind of time. Therefore we can’t draw any widespread conclusions throughout the league. It’s more-so you can just see how managers stack up against their peers. For the initial article I wrote, three years ago, I looked at the top six clubs, plus Everton because they were (at the time) managed by Carlo Ancelotti, and Leicester who were in the midst of back to back fifth place finishes. Last year Brighton and Newcastle were added. This season Aston Villa replaced Leicester, while Brentford and Bournemouth were also added (I also retroactively added Brentford to the 2022-23 data set). This gives us a good selection of teams up and down the table, but will still skew towards the top teams2.
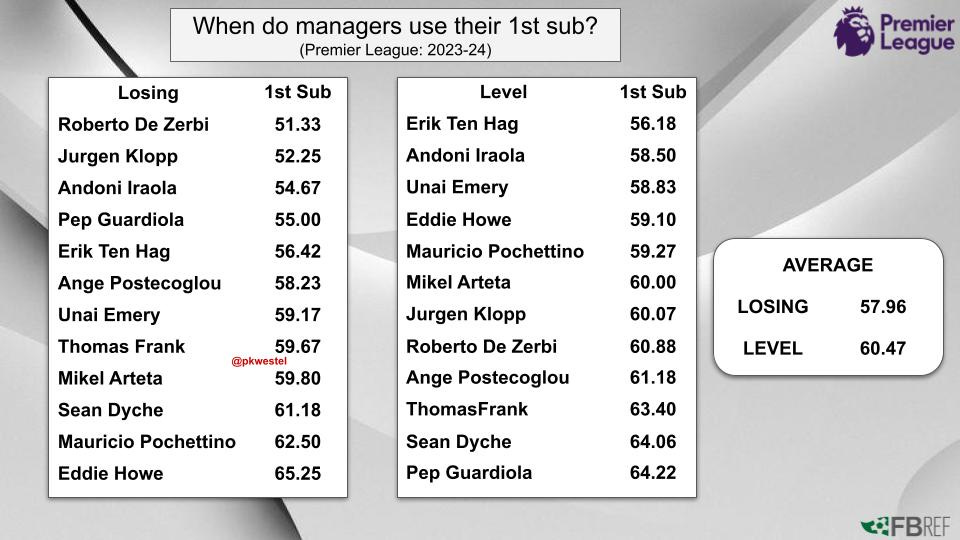
When substitutions occur
Last August Kwestthoughts published a newsletter arguing managers should be more aggressive when making substitutions especially when scores were level. Suffice to say this occurred as managers made their first change nearly two minutes earlier when scores were level and when they were behind.
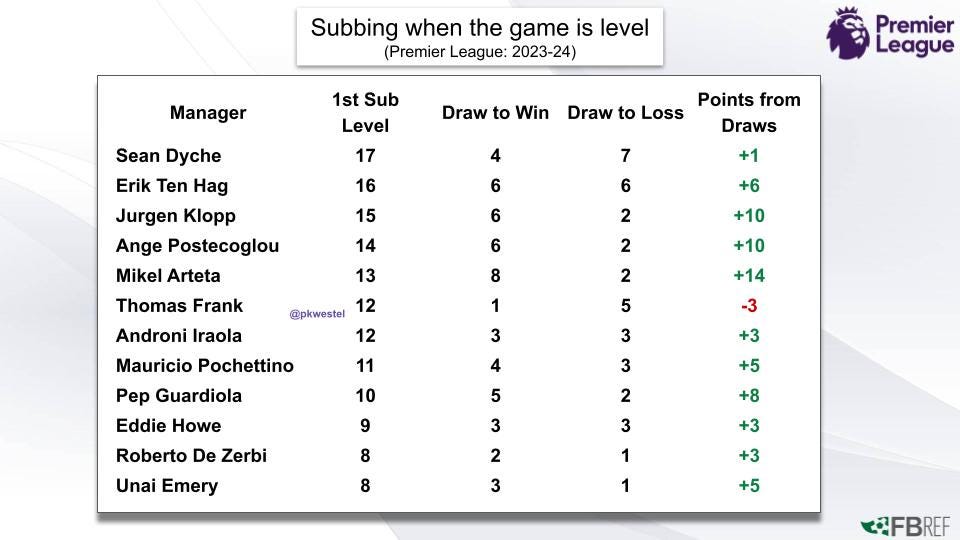
The result of this was… more points in the table! There were 145 matches where one of our 12 managers made their first sub3 when scores were level. 88 of those matches didn’t end in a draw - 51 turned into wins with 37 ending in losses.
When things are level around halftime, don’t be afraid to change things up. Over a third of the time (35%) managers made their first change with the scores level they won while only a quarter of the time did the match turn into a loss.
Given you get three points for a win and only one for a draw, even if you lose more than you win you’re still likely to come out on top. That’s exactly what happened with our list of managers. Only Brentford ended up worse off in the table than they would have have if every match that was level when they made their first change ended in a draw.
When matches are still level by the time the second sub is made the numbers remain strong, with 29.73 percent turning into wins and 16.22 percent going the other way. Yet as we’re going to see, when scores are level managers tend to hold back from using everything they’ve got.
Number of Subs
As noted, this was the second post COVID season where managers could make up to five substitutions per match and this season managers started taking a lot more advantage of this.
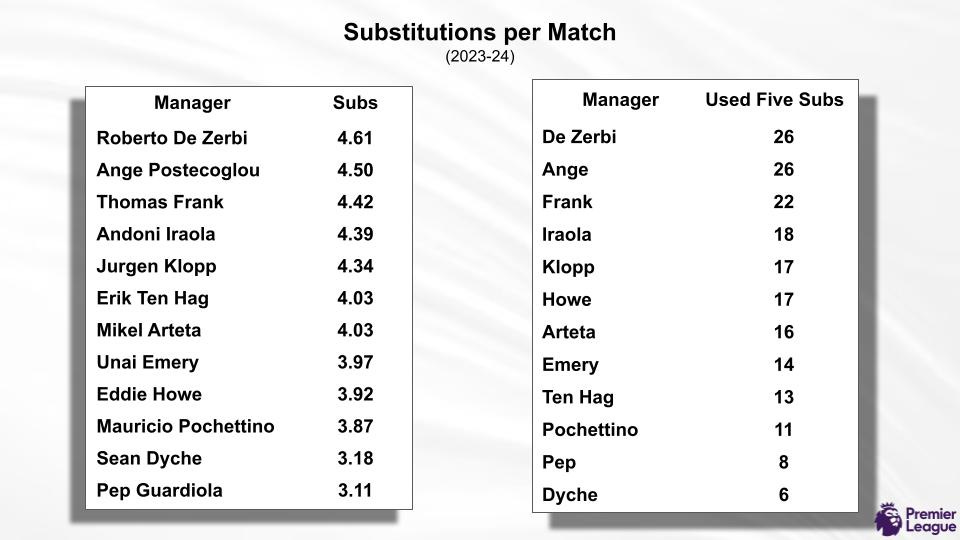
These numbers are up across the board. Average total subs per match rose by 0.23 while the amount of games managers used all five of their subs took a major jump from an average of 10.2 matches per manager to 16.08.
Another tidbit of the five substitution rules has been subs made at halftime don’t count as one of your three “windows.” This essentially encourages halftime substitutions as you’ll still have the same flexibility to make changes later.
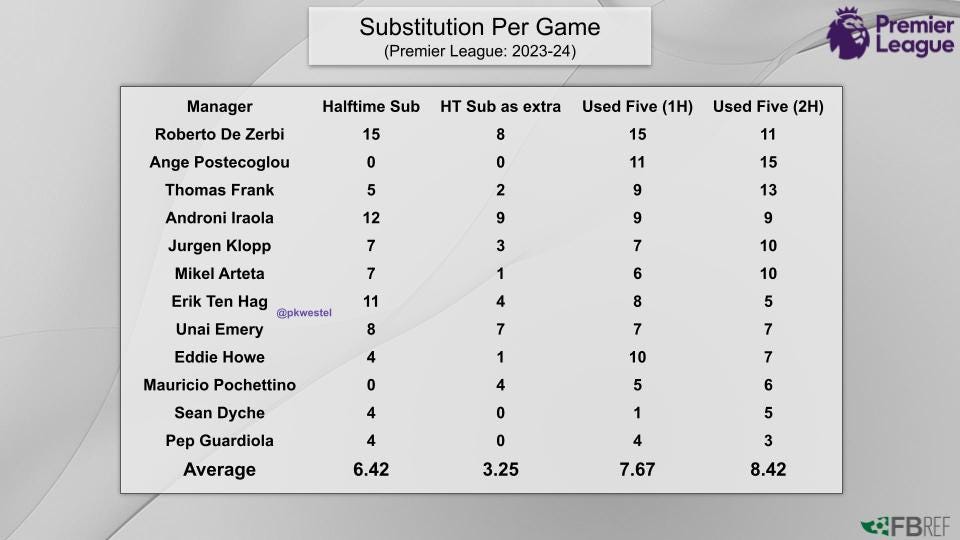
This season changes being made at halftime nearly doubled from 3.53. Using halftime as an extra substitution “window” is impacted by how many changes you’re actually making (if you make a triple change at halftime it’s impossible to use all your windows) but that number also rose from 1.41 in 2022-23.
Not surprisingly the number of times managers used all five substitutions increased in the second half of the season when legs were more tired.
Managers made five substitutions in 42.5 percent of all the matches in the sample. 53 percent came in games that ended in wins, 35 percent came in losses, while just 11.3 percent came in matches that end in draws. It was a total of just 22 matches, eight of which had the team trailing when the first sub was made while only three saw the team in the lead and blow it.
Only 23 times did they sub on their fifth player during the third window when things were level. Just twice did maxed out their five subs before the third window compared to 12 times when trailing and eight times when in the lead.
When things are level managers tend to get gun shy. While the average number of subs per game was 4.03 the breakdown is 4.1 in wins, 4.13 in losses, and just 3.63 in games that end in a draw. That’s nice increase from the 3.21 we had last year - and that 13.08 percent increase is the largest increase across the board - but that number should still be higher given how much there is to gain.
At the end of the day when things are level managers tend to leave a bullet in their pocket either because if they do score they want to then be able to make a defensive change to hold the lead, or more likely because they just don’t fully trust the options on their bench.
When you’re winning you can make more subs because you can give run outs to guys on the end of the bench. When you’re behind you’re more inclined to say “f-it” and roll the dice with more attackers (especially younger attackers). When things are level managers are still afraid of losing.
Impact of substitutions
It’s almost impossible to measure the impact a manager’s changes make on a game. As I’ve said before the points won from losing positions table isn’t really reflective of this because often times the game state changes before either manager has even made a change. Therefore I use my own +/- metric based on the state of the game when the managers makes his first substitution. (For a full explanation of how the metric is calculated click here).
In 2023-24, a lot of matches changed after the first sub was made, and a lot of it was for the better.
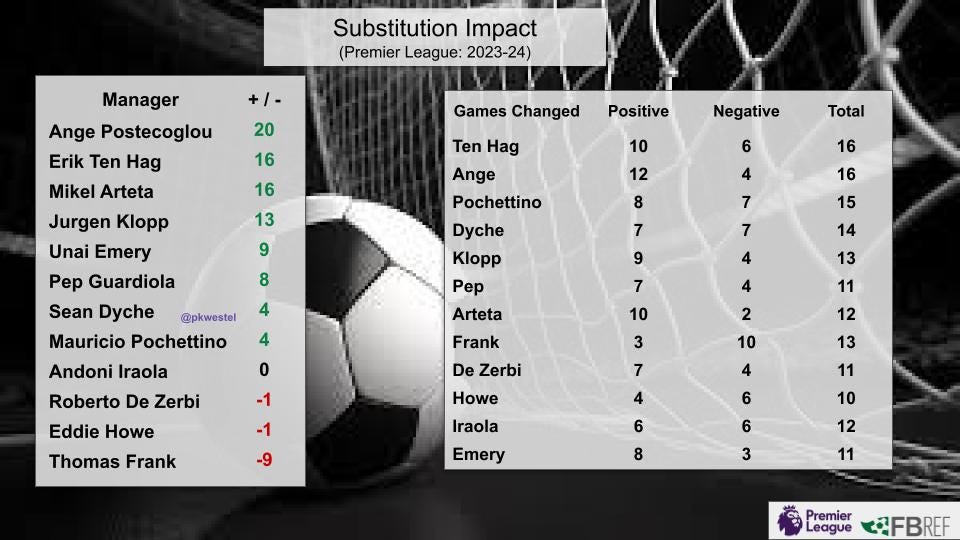
It’s been a few years of tracking this stat and I’m still not completely sure what to make of it. What I do know is it’s extremely volatile (Erik Ten Hag had a 0 last year, two years ago Mikel Arteta was -2, Klopp is always above 10 but almost everyone else who’s been above 10 was sacked the next season). In total the amount of matches that changed after the first sub jumped from 23.68 percent of all matches to 33.77 percent.
It would be extremely naive to look at this and say this vast increase is down to managers being smarter, or more aggressive, and really impacting matches without considering the wider trend of the 2023-24 Premier League season.
Goals.
There were 1246 goals scored in the Premier League last season, 162 more than the total scored in the 2022-23 campaign. That’s a 14.95 percent increase and an average of 8.1 more goals per team4.
Where did all those goals come from? The amount of penalties only took an 8.08 percent increase from 99 to 107, though penalty conversion jumped from 74.75 percent to 89.72. That only accounts for an increase of 16 goals. The amount of goals scored from set pieces rose by just 20.
The big increase was goals scored in open play, which saw a 15.5 percent increase jumping from 748 to 864. 116 more goals scored from open play. Nearly six more goals per team5.
Again, where are all those goals coming from? The answer to that is from two places.
The first is another rule change. Last season the Premier League started adding a lot more time on to the end of each half. This made matches much longer. This chart is from March, so roughly two thirds of the way through the season.

The average amount added time per teams is a hair under 12 minutes. If we extrapolate that out over a full season teams could be playing an extra five matches in added time alone.
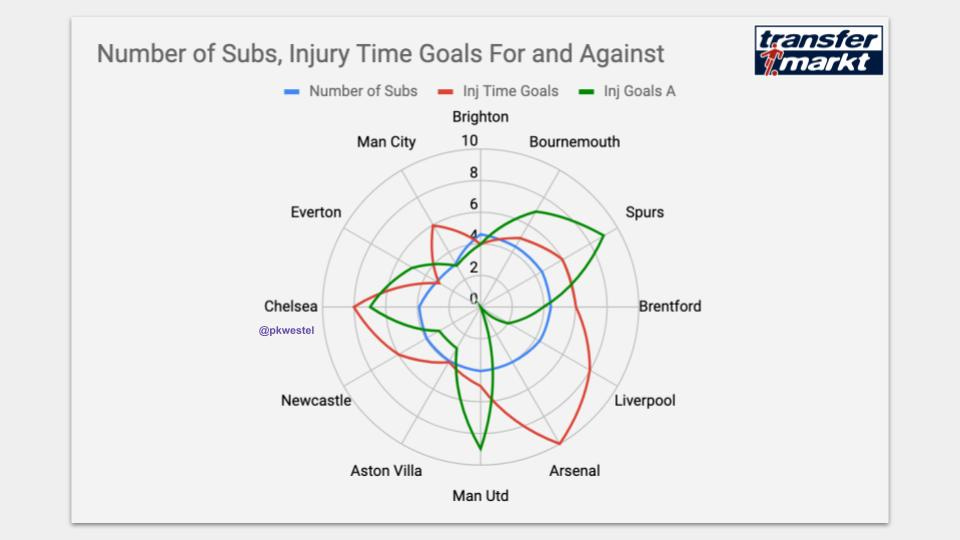
More added time means more tired players which means more goals. Goals in first half stoppage time only rose by 10 goals from 34 to 44 across the entire league6. However the amount of goals scored in stoppage time of the second half rose by 54 goals to 103. For context there were only 49 goals scored in second half stoppage time in the entire 2022-23 season!
The other newfound place for goals was the bottom of the table. The bottom 10 teams scored 92 more goals in 2023-24 than the bottom 10 teams in 2022-23. A number made even more astonishing considering in 2022-23 Chelsea were among those bottom 10 teams and last season’s bottom 10 included Sheffield United.
Now let’s add these two things together. Everyone scored goals, and they did it against everyone7. That lead to a lot of early leads that wouldn’t be held onto. About that whole points-gained-from-losing-positions table mentioned before, 2023-24 saw a lot more points gained from losing positions across the entire league.
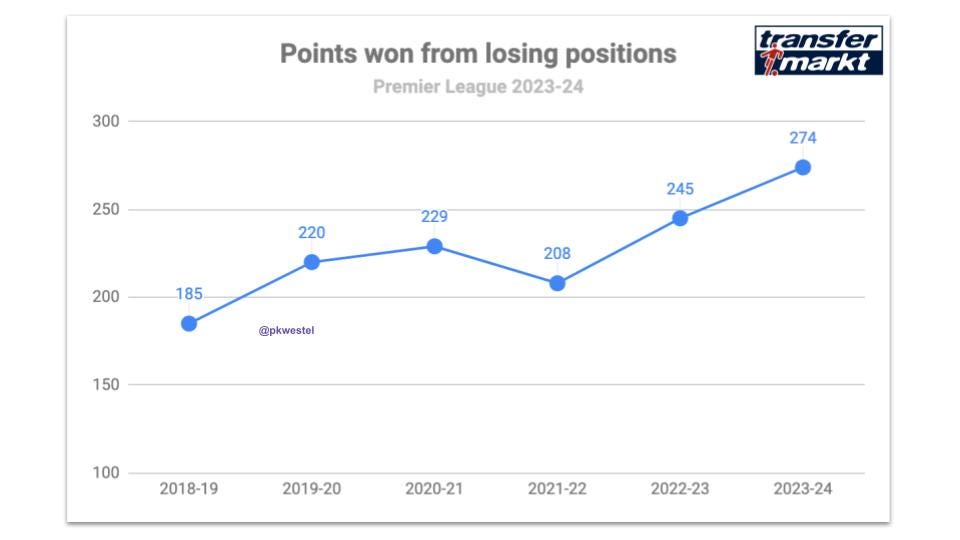
With both teams likely to score, we had a lot more matches that were level from around halftime to the hour mark when managers typically make their first change. That creates a lot more opportunities for that +/- to go up - especially because as the game goes longer than ever before the less talented team is far more likely to be negatively impacted by tiring legs.
Does making more substitutions help? Not really. As most teams are making around four subs per match, this just looks more like the teams with the better players tend to score late and the chaotic teams tend to do both.
Scroll back and you’ll see the top two managers for +/-, Erik Ten Hag and Ange Postecoglou, were also involved in the highest number of games that changed. Of the top teams in the league they were the most vulnerable to conceding to just about anyone, but their talent advantage over most of their opponents was usually enough to get them by8. Meanwhile a team like Brentford just didn’t have any squad depth. Their first XI could typically play teams pretty evenly, but once Thomas Frank went to his bench - which he did a lot - he just wasn’t able to match the quality and they’d concede late.
It’s going to be interesting to see if these goal numbers were a one off, or if they remain high as we get another year with more added time.
At the end of the day, managers shouldn’t be afraid to go their benches earlier if they’re not in a winning game state. But how much impact are their subs actually making? That probably just has more to do with how much talent they’ve got in their squad.
Guardiola typically ranks near the bottom of subs per match lists. Pep typically picks 11-13 players per match due to those players ability to see out a specific plan for that match. If City are winning he’ll give some other players a run out, but if they’re not, he sticks with his original guys because he sticks with his plan. He doesn’t tire his squad out because he knows midweek he’ll have a different plan that will require three or four different players than the ones that started.
Just wanted to give a shoutout to the 13 clubs in the sample for not sacking any of their managers in the middle of the season! 2022-23 was a nightmare.
For clarity first sub refers to tactical subs only. Substitutions made due to injuries are not counted
And then there’s Manchester United, who scored fewer
And then there was Manchester United, who scored six fewer
Which was still the largest total in the last seven years
This makes Arsenal’s 27.9 xGA and 29 goals conceded all the more impressive
Manchester United scored 10 winners or equalizers after the 80th minute last season in all competitions. Their highest total in the last 5 years.