
How effective are managers substitutions and when do they make them?
Diving in to a full Premier League season of substitution data for all the top six managers.

This post is going to be a bit different. There’s not so much of a narrative or an argument being made here, it’s more of a general data dump.
Two seasons ago I wrote about when Ole Gunnar Solskjaer made his substitutions in comparison to his peers. I compiled all that substitution data and since then… I’ve kept the database going. I’ve never really had a chance to write about it, but to help me convince myself that it hasn’t been a total waste of time, I’ve figured I should release the data.
I’m going to post the various things I looked at followed by some comments or thoughts. These aren’t conclusions1. Like I said before. there’s not really a narrative or argument to this post.
Let’s start with the data set2. It’s not comprehensive of all 20 Premier League teams for the simple reason that I don’t have that kind of time. Therefore we can’t draw any widespread conclusions throughout the league. More-so you can just see how managers stack up against their peers. For the initial article I wrote two years ago I looked at the top six clubs, plus Everton because they were (at the time) managed by Carlo Ancelotti, and Leicester who were in the midst of back to back fifth place finishes. I never dropped a team3 but this season I added Newcastle (for obvious reasons) and Brighton.
The sample consisted of a total of 380 matches. These are unique to each manager, so a Manchester United vs. Newcastle match would be one match for Erik Ten Hag and one for Eddie Howe, and thus count as two matches in the total number.
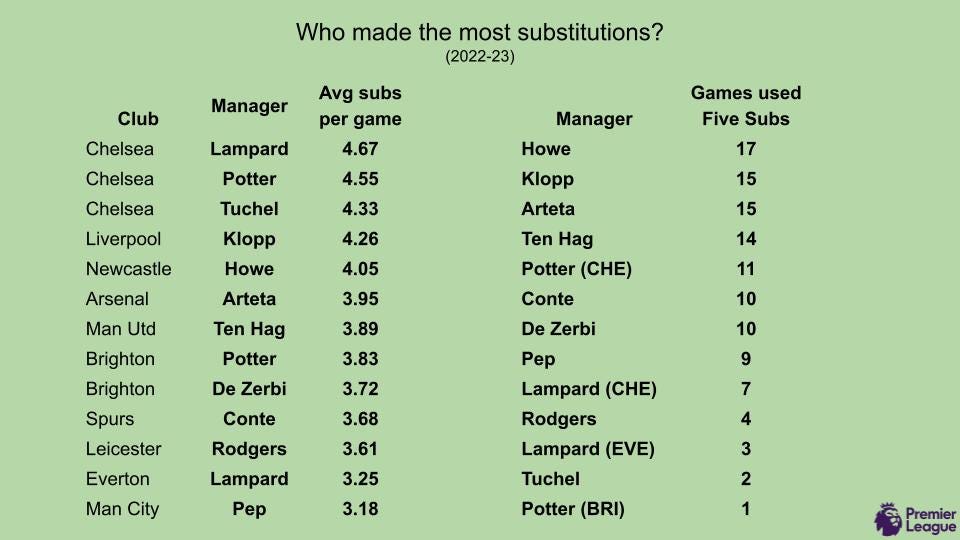
How many substitutions do managers make each game?
In the old days this wouldn’t really be a question. The number would be somewhere between 2.5 and 34 but this was the first full season where Premier League managers were allowed to make five subs in a match. This made it worthwhile to track as it gives us a little glimpse into how they view their squads. We also looked at how often they utilized the ability to make five changes in a match.
Observations
It shouldn’t come as a surprise that all three Chelsea managers are at the top of the list for most subs per game. It tells me that none of them ever really knew who their best XI. Can you blame them?
Pep using all five subs nine times caught me by surprise considering Pep doesn’t make subs. Sure enough they won all five matches where he did it.
As it’s the first season managers were allowed to make five subs, we don’t really have anything to compare this data too - except for the 9 or 10 games clubs played during Project Restart. That didn’t seem like a very comparative sample5 as at first look managers seemed to be just making subs because they could6 but I found this bit interesting.
During Project Restart the managers who used all five subs the most were Jurgen Klopp (7) and Mikel Arteta (5). They’re tied for second this season.
The majority of the list being between three and four subs per game is a good glimpse at how managers view their options on the bench. Managers typically believe they’ve put their best XI players on the pitch from the start of the match. If things aren’t going as planned, they believe the guys on the pitch are the ones who are most likely to fix it.
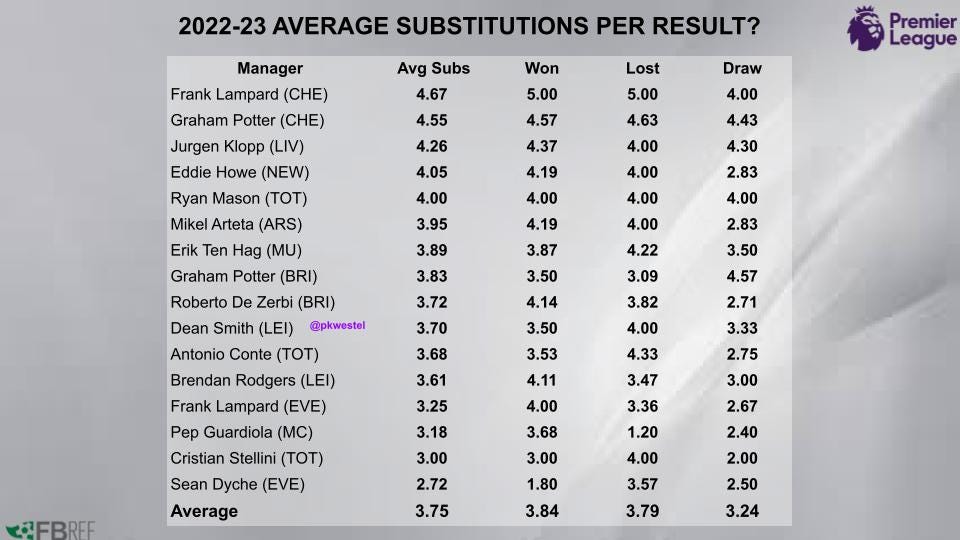
We see more evidence of this when we look at the average number of subs a manager each manager makes based on the end result of the match. We see managers tend to make more subs when they win, less when they lose, and the least when they draw.
How much did managers utilize the new substitution rules?
This was the first (full) season where managers could make up to five substitutions in a match. For managers who complain about fixture congestion and how often their players play, you would think they would utilize this to the fullest.
Did they actually do that though? Not quite. Only 31.84 percent of the matches in the sample saw the manager make all five changes. However they did make five changes more often than any other number.
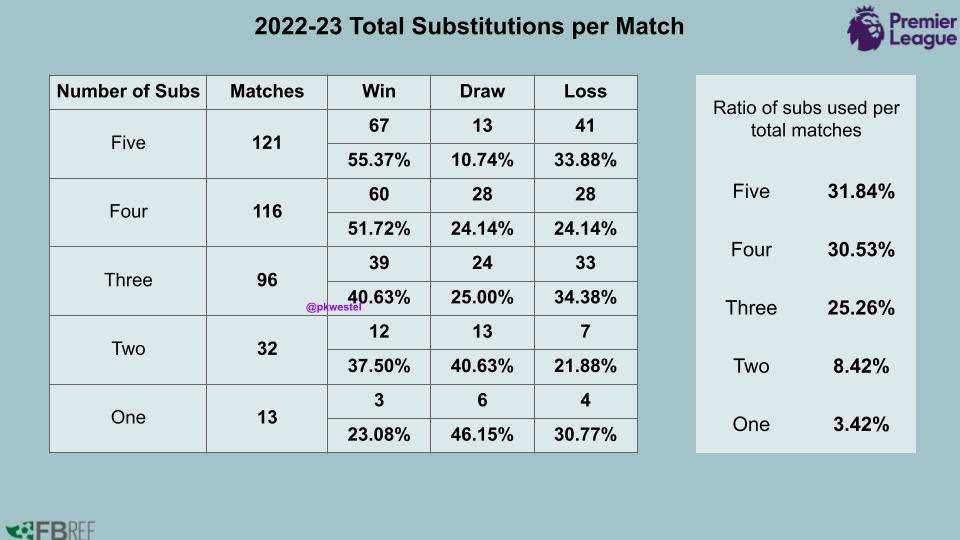
Given the previous data it’s not surprising that more than half the matches that featured five subs were wins. Another third came in losses where you typically have nothing to lose and managers are more willing to roll the dice.
Let’s also not forget that these numbers can be skewed considering the sample is mostly made up of the top teams in the league who are going to win the most games.
This was also the first full season to feature the “extra” halftime substitution window. This was one that managers really didn’t take too much advantage of. This season managers made 57 halftime substitutions. However only 23 times did they “take advantage” of the rule by using the remaining three substitution windows7.
Did things stay consistent throughout the season
This was a weird season given that a World Cup was jammed right in the middle of it. Given the pile up of matches early on in the season and when things got back going in January, I wondered if managers started making more changes as the season wore on.
For this one, I only looked at the managers who were with their clubs for (basically) the entire season. As it turns out, there sure was an increase in subs in the second half of the season.
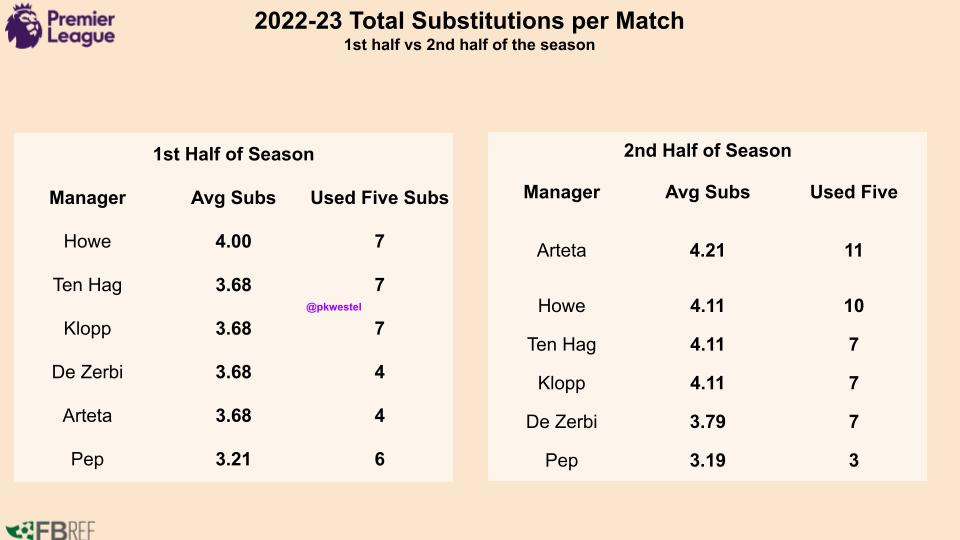
The number of subs per game increased by nearly a third of a sub going from an average of 3.66 to 3.92. Managers used all five subs 45 times over the second half of the season compared to 35 in the first half.
Now that we know how often managers made changes, the next question is, when?
When do managers make their subs?
It’s not hard to look up the average times that managers make their substitutions but that number possesses one problem. It’s messy and completely lacks context. Managers are going to act differently if they have the lead vs if they’re behind right? Furthermore an early injury can greatly skew the number.
In compiling the data I looked at all the game states when the subs are made and tracked accordingly. One thing should be noted: I don’t have time to look at each substitution individually and determine whether it’s tactical or because of an injury. Tactical subs can happen in the first half but they are incredibly rare, therefore every sub made before halftime is marked as an injury and doesn’t factor into the average time of the sub, while all subs (both tactical and injury) from the second half are included.
As this was the first season where managers could make five subs but only in three windows, double and triple substitutions became far more common. To simplify things, I tracked substitution windows, not the amount of subs made per window.
Here are the average minutes for when managers make each of their subs when they’re trailing or when the scores are level. Sorted by who makes their first sub earliest.

Observations
These numbers do factor in if a manager made a sub at halftime but don’t factor that halftime sub in if it was the “extra substitution window” (IE they used the other three windows during the match). There were only eight instances of managers using that extra halftime sub when they were trailing (and only Jurgen Klopp did it more than once) and five times it was used when a match was level. Not as often as you’d think.
In his six games in charge Thomas Tuchel’s second substitution window never came in a level game state (hence the N/A)8.
Brendan Rodgers made his first change almost 10 minutes earlier when the scores were level than when he was behind, which goes against pretty much what everyone else did.
Unlike previous years, the average time of the first and second sub was almost identical when matches were level or when managers were trailing. This is likely due to making more double or triple subs on the first go.
However, consistent with previous years the average time of the third sub was significantly later when scores were level than when they were trailing. Combine that with the lower of subs made in games that finished in a draw and we have a good look into the psyche of a manager. While fans are all screaming for a team to go and win the game, managers are more worried about taking a risk that might cost them the point they already have.
Many times managers leave subs in their pocket. In the sample of 380 matches, 85 ended in a draw. In 44 of those 85 matches (51.76%) the third substitution window wasn’t used, yet in only 13 of those matches did managers use all five subs. In most cases when the scores were level, managers used that third window to bring on a defensive player to help protect the point they already had, rather than try going for another two points.
We know how many subs managers are making and we know when they’re making them. That leaves just one more question:
How impactful are each manager’s substitutions?
There isn’t really a great way of measuring the impact of substitutions. You can look at this chart here from The Athletic but I’m sure you’ll notice a major problem.
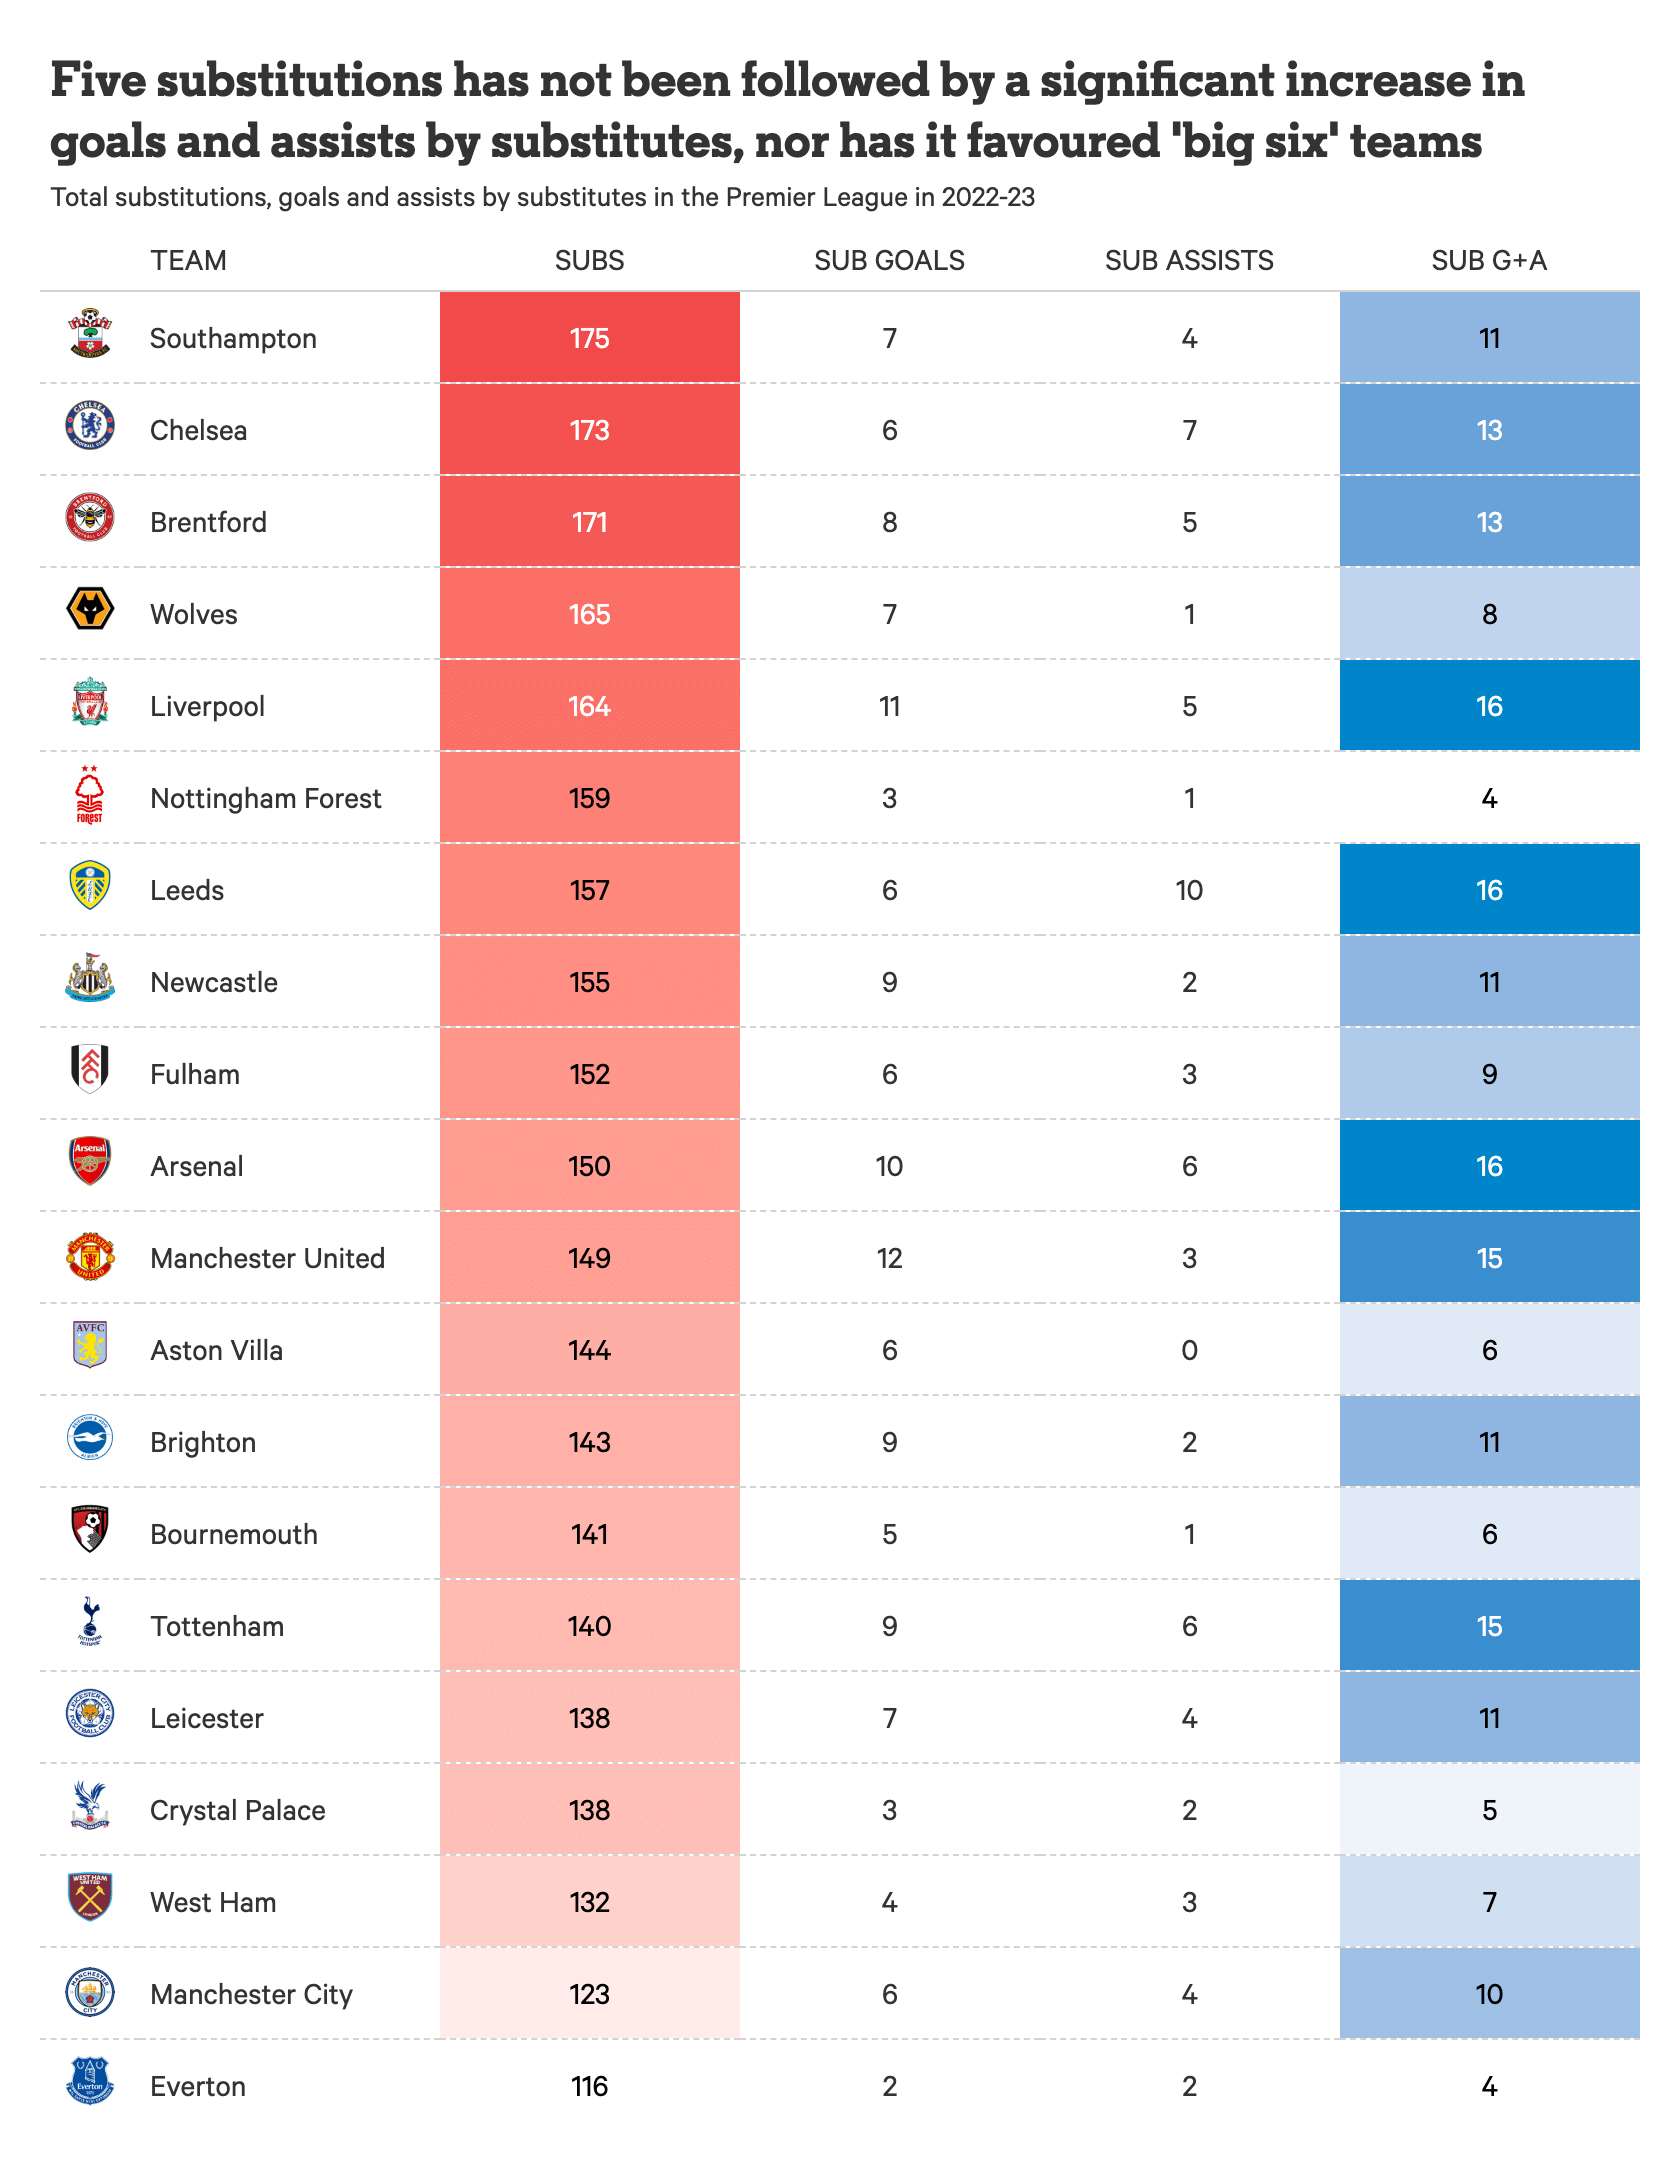
The chart only shows goals and assists recorded by substitutes. That’s really not a lot of info. Did those substitutions change the game or did they score when their side was already 2-0 up?
If you’re only looking at the substitute you could be missing a huge piece of the puzzle. Sometimes a tactical sub changes the shape of a team, leading to an equalizer or a winner that the sub has “no” involvement in. That’s not going to appear in this chart but in that particular case, the substitution was crucial part of the match.
Furthermore, not all substitutions have positive impact, some of them go the other way. Sometimes you take a player off, which slightly changes your shape, and your opponent suddenly gets a foothold in the match that they didn’t have before. An equalizer is conceded through no fault of the player who came on, but it was a consequence of making that substitution.
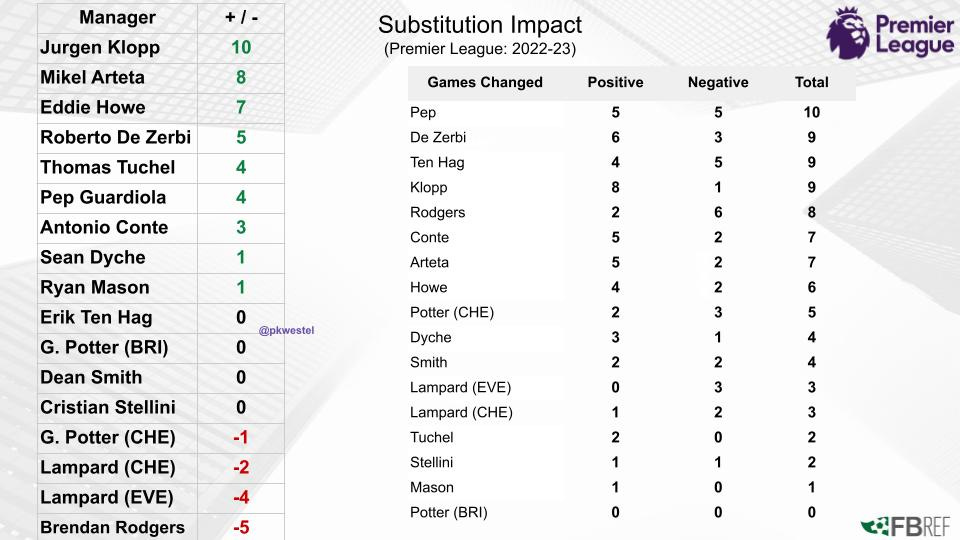
To better measure how impactful manager’s substitutions are, I created a simple +/- metric. Compare whatever the gamestate is when a manager makes his first tactical sub (IE halftime or later) with how the game finishes and either reward or dock the manager the points reflected in the table.
For example if a manager’s first sub comes when the scores are level, the team currently has one point in the live table. If anytime after the first sub his team scores and goes on to win the game, they’ll get three points in the table. So the sub(s) were worth +2 points. If they had conceded a goal and lost, it’d be worth -1 point9. If the gamestate never changes your score is zero.
Is this metric perfect? No. Is it simple? Yes.
Here’s what it looked like this season.
Observations: I’ll be honest - a lot of what I take away from this comes from knowing how previous years’ data looks
There isn’t much correlation between the earlier you make subs and having a high +/-. Yes Jurgen Klopp made the third earliest subs when he was losing and has the top score, but Arteta, Howe, Conte, and Pep all scored well and they made the latest subs when their teams were trailing. Last season Klopp was +11 and he made the latest subs when his teams were trailing (Pep made the second latest subs and was also +11). Two years ago Ole Gunnar Solskjaer was the earliest to make changes when his team was trailing and he lead the way with a +9.
Perhaps be wary about being too eager to make changes when things are level? Rodgers, Potter (CHE), and Lampard (CHE) made the earliest changes when things were level and they make up three of the bottom four slots.
Pep Guardiola makes the least amount of changes but had the most games impacted - though just as many went the wrong way as the right way10.
These numbers in general are pretty volatile. Many managers swing from one year to the next. Jurgen Klopp is the model of consistency in here and it simply comes from consistently in going from draws to wins.
Overall, most substitutions don’t end up changing a match. Only 89 of the 380 matches (23.42%) saw the outcome change between the time of the first sub and the final whistle. That number is down this year, the last three years have averaged 28.27 percent, which could be a byproduct of the five substitutions11 rule.
Just over one out of every five matches changes once substitutions start happening. 80.22 percent of matches that were won had the team already leading by the time the first substitution was made. 80.7 percent of losses had the team already trailing when they made their first sub. In only 24 matches did a team that was trailing when they made their first sub end up getting points from the match.
When subs do make an impact, it’s hardly a guarantee it’s going to be a positive one. Only 57.3 percent of matches where the outcome changed had a positive change, and I’d be willing to bet that number is skewed on the higher side due to the sample being primarily made up of teams at the top of the table.
Fans are always going to want managers to make more changes, especially when things aren’t going well. My biggest takeaway from all this data is, for the most part, managers typically believe they’ve put out their best 11 players from the start of the match. When things they aren’t going well they still think the guys on the pitch offer them the best chance of turning things around. It’s hard to say they’re wrong.
Looking at the data from the last 4-5 years the only conclusion there really is is that there’s not much correlation between any substitution data and success
All stats were compiled via Fbref
Will be able to swap a team in for Leicester next season. Probably Unai Emery’s Villa.
Unless you’re Pep in which case it would be 2
For various reasons such as matches played in the summer heat, managers making subs just because they could, or Liverpool seeing out a title win and letting all their fringe players rack up appearances.
Managers used all five subs in 40% of the small number of matches in the sample. This season it was 31.84%
Managers used all five subs in 15 of the 36 matches where they made a halftime sub but didn’t use it as an extra window, so it’s not a case of making double/triple subs and not having any subs left.
Against West Ham the scores were level when he made his first change. West Ham scored and thus Chelsea were down at the time of the second sub. Chelsea equalized and the third sub was made when the game was level
If a manager makes a first sub and his team scores, then after the second or third sub they concede and bring things back to level their score would be 0.
+4 is pretty in line for Pep. Last year he was +11 which was an outlier. Previous years he was +3, 0, and +3
I originally thought it could be because I included more teams in the sample this year but the teams I added (Brighton, Newcastle) were among the highest in games changed. Ultimately we won’t know for sure until next year.