Manchester United xG underperformance: The blindspots of xG
Expected goals can tell us the story of a match but it tends to leave out some very important details
Author’s note: The summer of ‘unfinished thoughts’ continues. I started writing this piece back in January focusing on two specific matches. The piece got put on hold due to work but then I noticed this trend was bigger than just two matches, and thus, a multiple part series was born. Part II will drop later this week.
The modern football data revolution truly kicked off with one stat: expected goals (xG). It was the first advanced metric to break into the mainstream, albeit often with misunderstanding, but it’s safe to say xG has been the backbone of the entire movement.
xG is by no means perfect and, other than raw defensive stats, is probably the most mis-used stat out there. The stat has plenty of flaws, starting with it’s name. Expected goals was not a great choice to try and get the notoriously stubborn football community on board with data.
Before we go anywhere further, let’s do a quick primer on what xG is. Per Fbref, xG is the probability that a particular shot will result in a goal. The most sophisticated models take into account:
location of the shot
body part (head, foot, other)
weaker foot or stronger foot
type of pass that set the shot up
state of play
goalkeepers positioning and positioning of other defenders
Every shot is compared within a database of thousands of shots of similar characteristics to determine the probability that this particular shot will result in a goal. Here’s the kicker, that database is comprised of shots from everyone. So when Rasmus Hojlund takes a shot, the xG is determined based on similar shots that could have been taken by Lionel Messi, Robert Lewandowski, Jamie Vardy, or Aberdeen striker Kevin Nisbet.
Add up the xG values of all the sequences for each team at the end of a match and that gives you a good idea of which team was a more deserving winner.
If you missed the match and just check out the numbers, it’ll tell you that Manchester United pretty much dominated this match and thoroughly deserved a win.
However, sometimes the numbers will make you go WTF?
Just from looking at this you can tell that Arsenal dominated the match, but what happened? You do a little more research and you’ll see there was some game state at play - United went 2-0 up inside the first 11 minutes - but mostly it was a case of David de Gea playing out of his mind. The Spanish goalkeeper made 13 saves and prevented four goals more than what Arsenal would have been expected to score based on the shots they took and the locations they put those shots in. You don’t need to do much research to see that even with the game state Arsenal got extremely unlucky on the day. Sometimes you just run into a hot goalkeeper.
Ask a data analyst and they’ll tell you single-game xG is pretty useless. You can’t make any long term analysis from one game of xG data. The stat works best over long periods of time with the idea being that over the course of the season players and teams will typically score right around what they’re cumulative xG says they should score.
Single game xG is very volatile. Game state changes things. Sometimes a mistake is made leading to a really high xG chance that skews the numbers.
But there’s a bigger flaw in single-game xG that will also pop up in your cumulative totals. Single-game xG doesn’t take into account who is taking the shots.
Author’s note: A data scientist may read the rest of this article and tell me that I am unequivocally wrong. If that happens, I would side with them because data scientists tend to be smarter people than I am. Nevertheless I believe in my point and I’m going to do my best to spell it out for you here.
Manchester United played two games last December that really stood out to me in terms of the numbers not quite matching what I saw on the pitch.
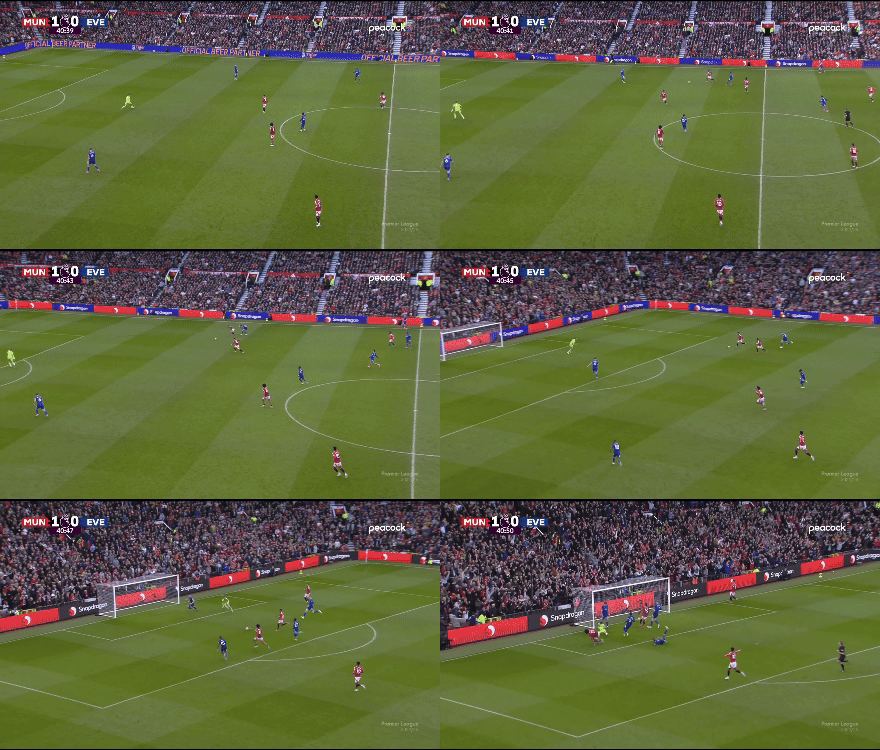
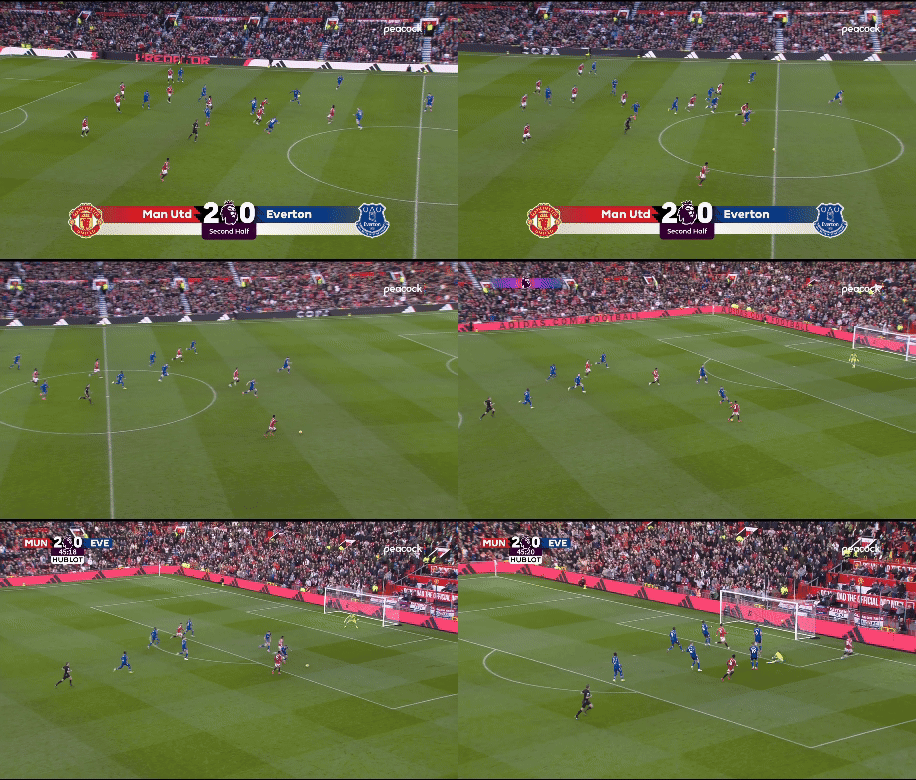
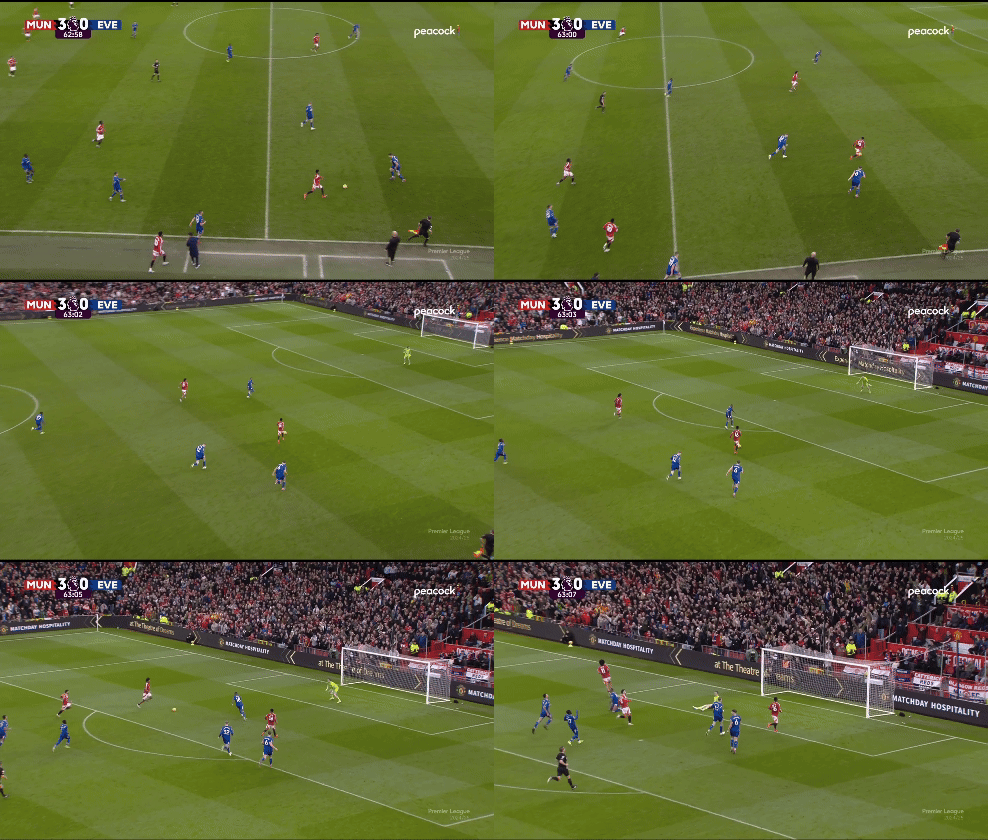
The first was United’s 4-0 win against Everton. Things were a bit nervy for the first 20 minutes and things could have been much different had United been facing a better team than Everton. Eventually United settled down and blew them away. Other than a bit of luck on Marcus Rashford’s opener, the other three goals all looked like pretty decent chances that United should score.
There was striker Joshua Zirkzee’s first goal coming in transition after a great defensive play by Amad leaving Jordan Pickford hopelessly out of his net.
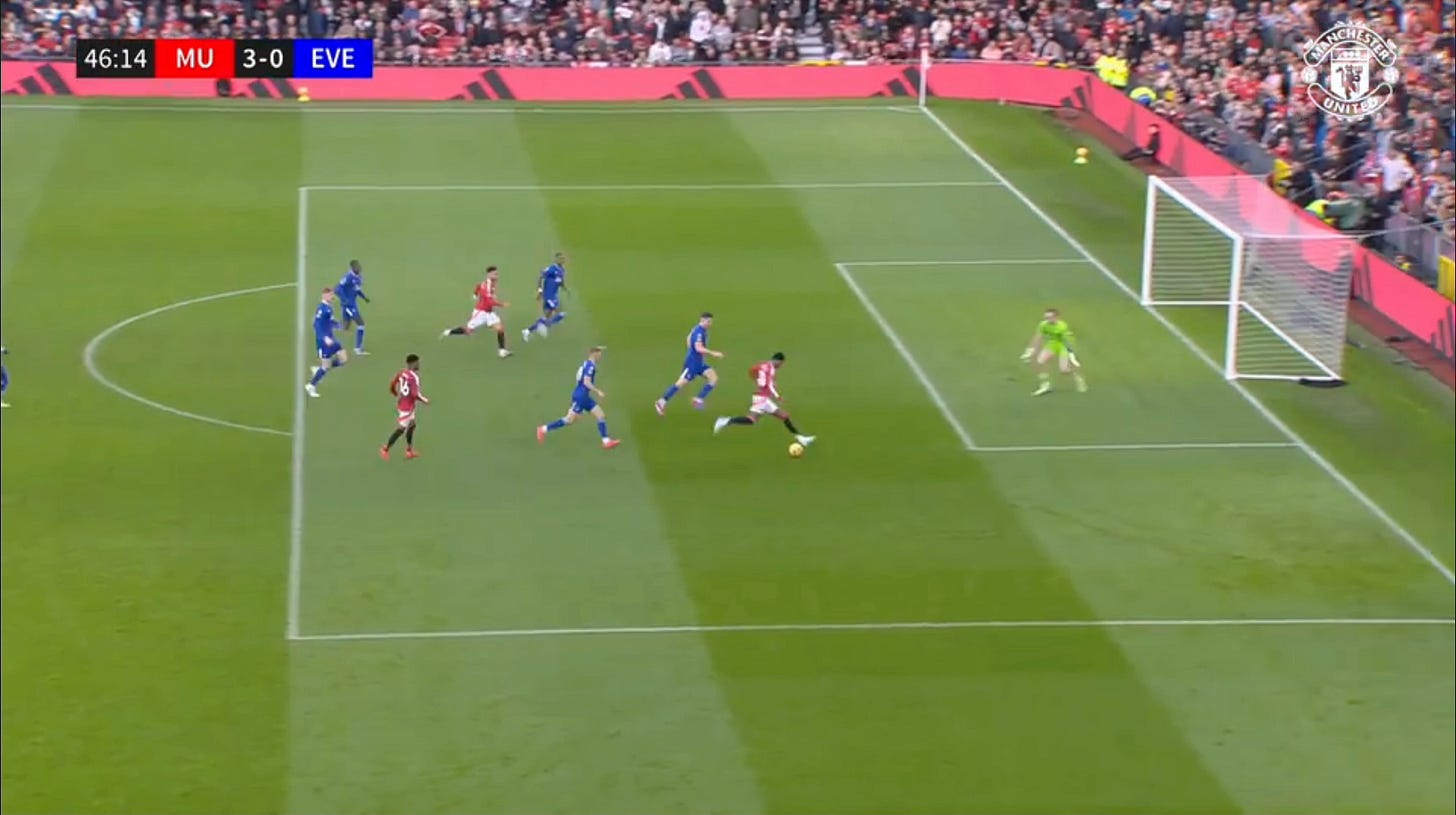
Marcus Rashford scored a second goal after being played in 1v1 against the goalkeeper.
And Zirkzee added a second again on a 2v1.
The xG value of Zirkzee’s goals was 0.11 for the first and 0.2 for the second. They aren’t the simplest of finishes but when you come in on a transition like that and play a square ball across, you are by no means surprised that he’s converting the chance into a goal. Even though United finished the match with “only” 1.3 xG, it wasn’t much of a surprise they scored at least three goals from these specific shots. They are the types of chances that Zirkzee and Rashford are particularly good at finishing.
The next match to catch my eye was three weeks later when United lost to 3-0 to Bournemouth. The xG for the match came back 2.2-1.6 in favor of United. Bournemouth had a penalty in there as well, remove the penalty and it’s 2.2-0.8. On xG it appears that United thoroughly outplayed the Cherries and merely got unlucky.
There was some major game state at play here. For the first half hour Bournemouth thoroughly outplayed United. When Bournemouth went 1-0 up after 29 minutes, United had taken just two shots.
Once Bournemouth had the lead they sat back and let United have the ball, confident that United wouldn’t be able to do much with it. They were right. United took 21 shots over the final hour for just 2.04 xG - a mere 0.09 xG per shot.
Mixed into those 21 shots were three chances above 0.2 xG. There was Bruno’s shot at the end of the first half (0.22 xG).
Diogo Dalot’s header early in the second half (0.28 xG).
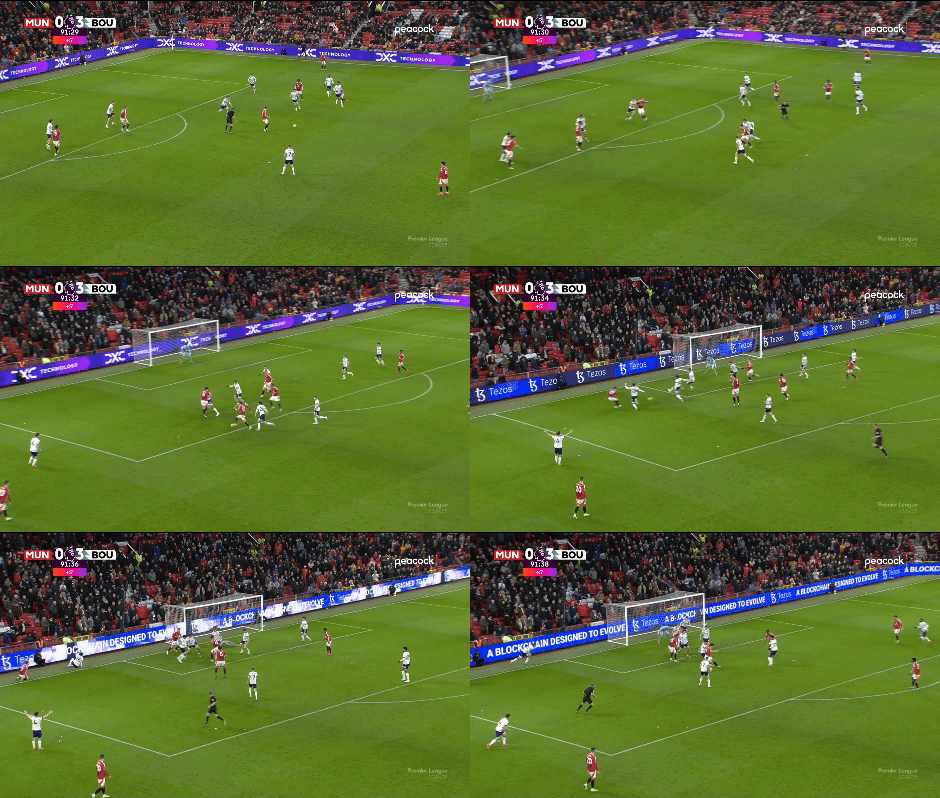
And Leny Yoro’s late chance (0.3 xG).
What single game xG doesn’t take into account is that not only do these chances carry the weight of United’s xG total for the match, they aren’t all that big. Dalot’s header is a flaw in Opta’s xG model which doesn’t do a great job calculating headers. Headers are really difficult to score on. That chance should never have been 0.28, it’s far more difficult than that - especially with defenders all over him.
As for the other two, xG models don’t account for who is taking the shot. It simply assigns the number and moves on.
Finishing is inherently a skill that some players are better at than others. Rashford’s second goal against Everton had an xG value of 0.33. The rule of xG states that if you give Rashford this shot 30 times he would score 10 goals.
I do believe the average player would score 10 goals if he took this shot 30 times but when it comes to Rashford I would expect him to score closer to 18 if not 20 goals from 30. 1v1 finishing is Rashford’s bread and butter. I’m willing to bet throughout his career he’s over performed his xG on this type of shot while underperforming his xG on other types of shots. This is his skillset.
Let’s contrast this with the chance Leny Yoro missed at the end of the Bournemouth match.
Yoro gets the ball just outside the six yard box. There’s no defender in front of him, the goalkeeper is out of position, he’s got an open net and all he has to do is pass it into the net.
The xG value of this chance is 0.3 and maybe you even think that’s low. xG states that you give this chance to Yoro 30 times and he should score 10 goals, but there’s some additional context missing here.
Let’s start here. Leny Yoro is 19 years old. This was just his fourth appearance in the Premier League for Manchester United. Yoro is a defender and prior to this moment he had taken just 16 shots in senior football. None of which had an xG value as high as this one. This chance is a foreign situation for Yoro. Put it all together and do you really expect him to finish this chance almost a third of the time?
Sure over the span of 30 attempts he’ll maybe score 10 of them but as a defender he’s unlikely to even get 30 of these chances over his entire career. Even if he hypothetically did, by the time he’s getting those later chances he’d have plenty of experience at them. You just can’t replicate how he’ll do when he gets this chance four games into his Premier League career.
Give a veteran player a chance that’s right in his wheelhouse and you can expect xG over-performance. Give a chance to kid whose never been in that situation before and you could almost expect under-performance.
That’s the blindspot of single game xG. It just spits out a number and gives you the impression that one team either got lucky or extremely unlucky on the day.
It doesn’t take into account who is taking the shots. And who is taking the shots really matters when it comes to how teams perform against their xG.
But that’s Part II.








I quite like that xG ignores the shot taker. That means it can be used to assess the real quality of the chances.
If your style of play regularly creates seemingly gilt edged chances but they fall to a CB, you'll want a CB who can finish, or you'll realise you need to tweak some patterns to get a more natural finisher into those positions.
If your chances are falling to your striker but they're underperforming on xG, it tells you a better striker is needed.
If xG took the player or the position of the player into account, you'd only be measuring them against their own metric, meaning Rasmus's average would look just as good as Ronaldo's. Lowering the expectation based on the players lowers the accepted standard too.
Thanks Pauly for your read. Love it as always.
I’ve been reading quite a few stats related articles lately, and you highlighted the most commonly misunderstood thing about xG - it’s a measure of chance, not quality of finish.
And for the latter, that’s why we use xGOT - expected goal on target.
But I’m sure you know that already. So I’m just gonna look forward to your next article!